When Written: Feb 2010
The ability to move back in your code is a first for web development
I guess the big news for anyone developing with Microsoft technologies is the release candidate of Visual Studio 2010 and .Net 4. Whilst I have mentioned these before, this was when the products were only beta. Now that release candidate as appeared the license has been changed to allow use of these in a live environment. So Visual Studio 2010 is available to those of us who have to produce reliable workable code so that we can eat , and the fact that both Visual Studio 2010 and .Net 4 will coexist with their previous versions on the same machine, there is little reason not to download and have a play.
What does this new version have to offer? I covered some of the new features in a previous article, but what I want to write about here is an impressive enhancement to the debugging capabilities in Visual Studio. I can’t emphasise enough how useful decent debugging capabilities are when developing web applications, it really speeds up development. Many of us remember the bad old days of web development when the only way of checking variable values was printing them on the web page.
The ability of stopping code execution and stepping through your code like the ‘proper’ coding environments out there offered, was a just a dream. It was many years before web developers were given similar capabilities to their colleagues who were developing desktop applications. The balance has now been corrected to a large extent in Visual Studio where the debugging capabilities are similar irrespective of the platforms that you choose to develop for. Before you think ‘so what?’, this is still not the case with a lot of current web development tools: even the latest version of one of the market leaders has no real debugging built in. I can’t tell you which product this is as I would have to kill you dear reader, or at least I think that is what the NDR that I signed said!
Back to Visual Studio 2010, one very useful ability that we had way back in Visual Basic 3 but has been missing in ASP or ASP .NET development is the ability to break at a point in your code and then move back to a previous point in the code and re-run. How many times have you stepped through code only to step past the critical bit and want to ‘go back’ and run that bit of code again? Or perhaps re-run those last few lines again but with a different value for one of the variables? With Visual Studio 2010 this is now possible with Intellitrace.
I’m not one for mentioning that something exists without trying it for myself , just in case the marketing ‘boys’ have got too excited again, so I decided to give it a go. After installing Visual Studio 2010 Ultimate I opened a project of a web site that I have just finished (yes I had made a back up) marked a line of code to stop execution at a breakpoint and started the web application running with debugging turned on as usual. When the application reach my breakpoint it stopped as expected. I then single stepped through a couple of more lines of code and then dragged the yellow arrow pointer that was showing the current line that was being executed back a few lines and then single stepped forward as normal.
This feature just worked straight out of the box, despite reading on some blogs that getting this feature to work was tricky. There are a couple of settings you can ‘tweak’ which varies the levels of data collected for Intellitrace. With the lesser level of data not all the properties of every object are captured, whilst at the higher level, the performance of your application can be affected. How often have you slowly single stepped through several lines of code only to jump past the troublesome piece of code. Until now the only option would be to run the code again from the start. Now all you have to do is drag the small yellow arrow that marks the current line of code to be executed back a few lines and step through your code again. You can also alter variable values so you can test your code against various values, again without having to run the whole application from the start.
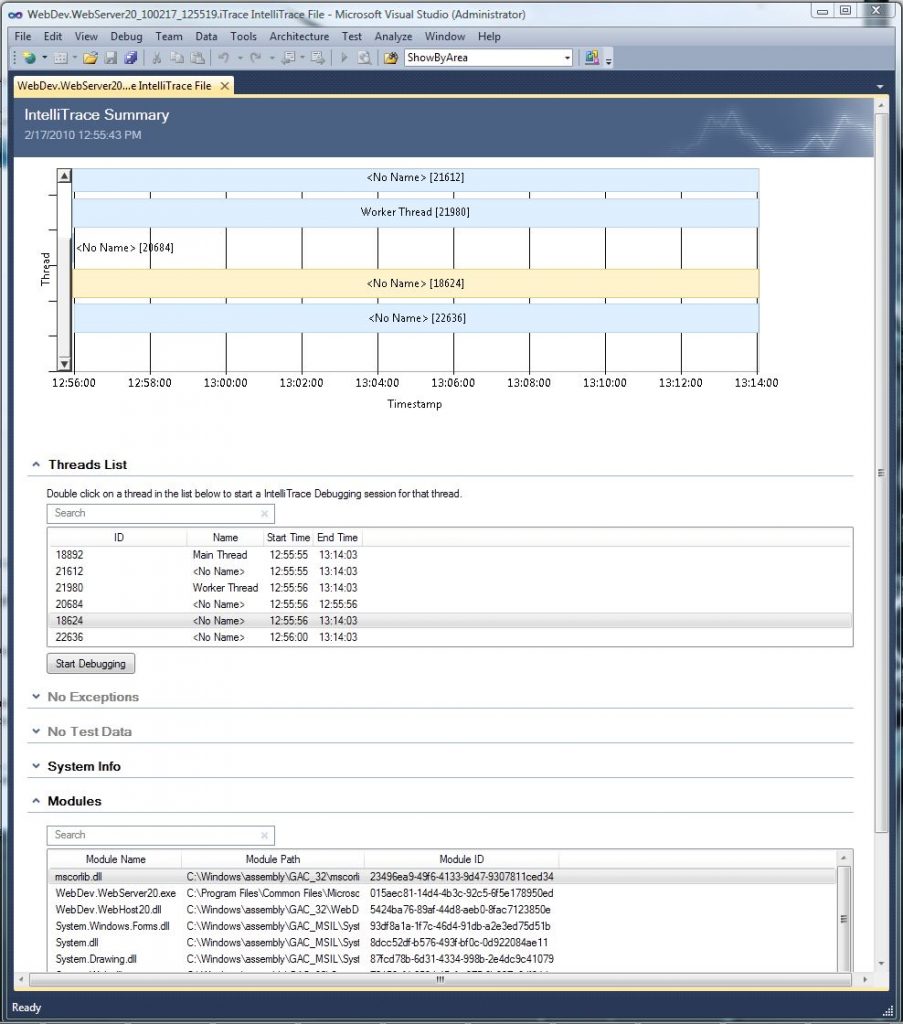
I know we have had this sort of thing in Visual Basic ( but not C++ ) for some time but to have it in a web application environment is really quite something and Microsoft should be praised for really trying hard to make web application development that bit easier. Intellitrace achieves all this by generating an iTrace file. Now things start to get interesting here. By taking an iTrace file and running through either Visual Studio or the new Microsoft Test and Lab Manager ( MTLM) faults and bugs can be easily reproduced, which will be a great boon to larger development environments where testers can submit an iTrace file to the developers and the programmers will be able to reproduce the fault easily and examine all the variable values at the time of the fault.
To produce these iTrace files you don’t even need Visual Studio to be running as there is a command line tool called IntelliTrace.exe which will create iTrace files for importing into the developer’s Visual Studio at a later date. Firstly a couple of important points, one is that the size of the files is limited so your hard disc doesn’t ‘disappear’. This limit is changeable as is the location of the file which by default on a vista machine is at “C:\ProgramData\Microsoft Visual Studio\10.0\TraceDebugging\”.
The second point is that the files are deleted when you close Visual Studio so remember to copy them out if you want to move them to MTLM or pass them to someone else for examination. If you load an iTrace file into Visual Studio a view will be presented of all the threads that are running in your app and you can re-run the program execution and study the status of the various modules loaded. You can also examine each step of the debugged program. Having the ability to ‘replay’ such events should make life a lot easier for others to help fix code that is not working as expected.
Article by: Mark Newton
Published in: Mark Newton